INOSIM Software
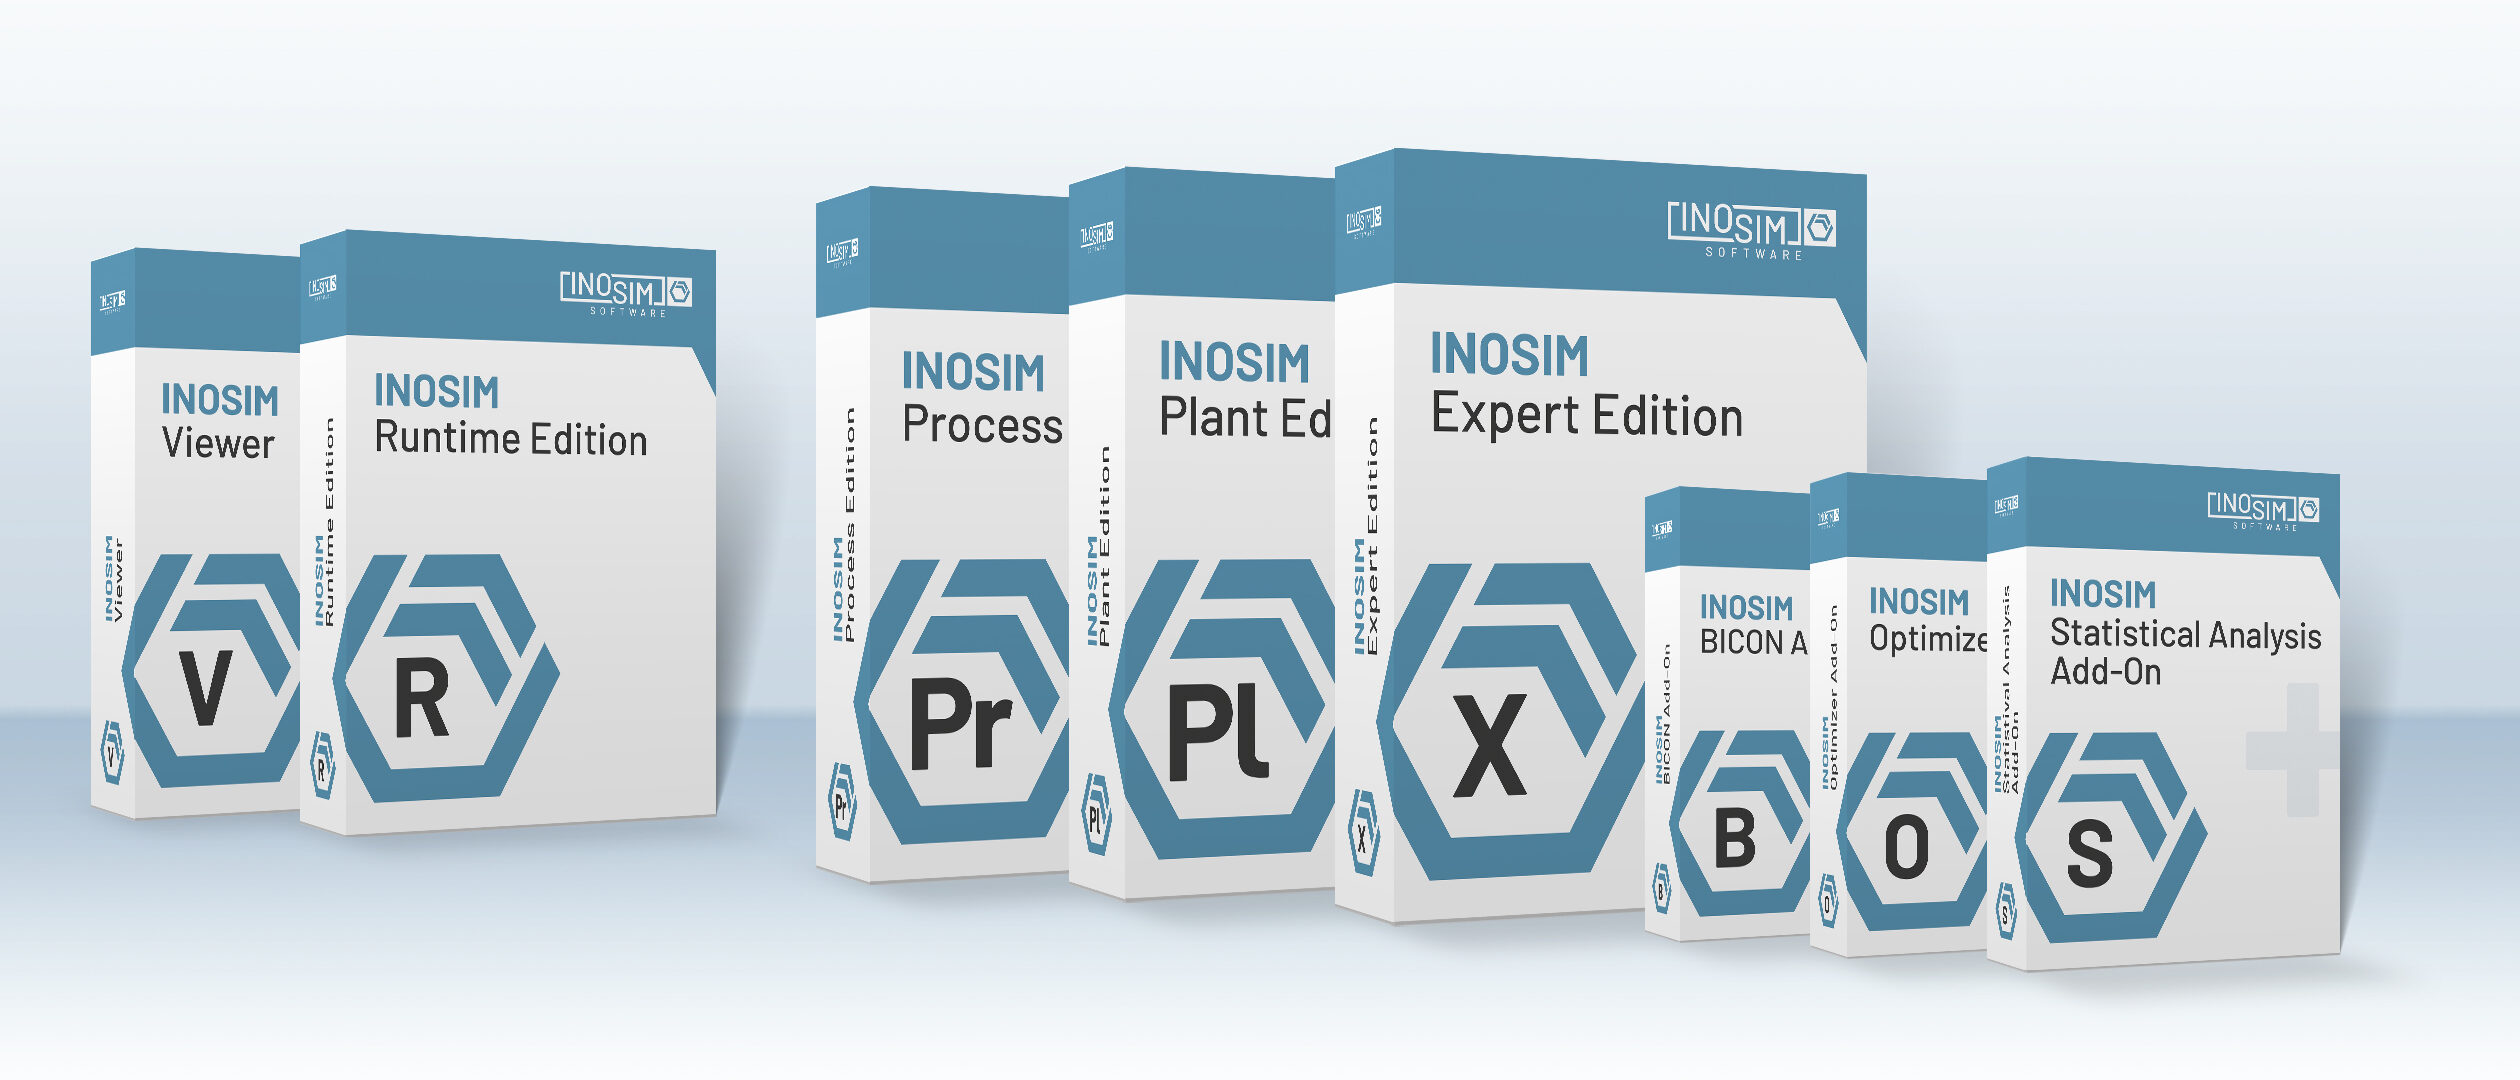
INOSIM is a flexible process simulation tool capable of handling even the most complex of production processes. Quickly perform virtual experiments in our powerful simulation suite to obtain quantifiable and qualitative data to guide your important decisions. We are offering the three simulation environments (Expert Edition, Plant Edition, Process Edition – view comparison ) and a multitude of compatible add-ons.
INOSIM Runtime Edition
The INOSIM Runtime Edition is for those who wish to make parameter changes (recipe and unit parameters, excel inputs, etc.) to an existing INOSIM model, but do not need to make structural changes like adding equipment to the layout or altering the order of operations within a recipe.
Limited access, but offered at a significantly lower price, while maintaining the same quality of performance.
INOSIM Free Viewer
Use the INOSIM Viewer to view simulation models and results without a license. You may access all the model elements to check input data such as recipe structures, parameters, and order lists. However, you may not make any changes to them or execute new simulation runs.
Results may be exported as Excel reports or viewed in the INOSIM Gantt chart.
INOSIM’s Key Features
INOSIM models are easy to understand, use, and maintain, even if you are not a simulation expert. We use model elements that any process engineer is familiar with, such as graphical production recipes, equipment and unit pools, production lines, resources (e.g., utilities, operators, …), shift calendars, and many others.
INOSIM provides a maximum degree of flexibility that lets you model even the most complex plants faithfully, be it batch, continuous, and mixed plants.
With our integrated scripting engine, you can customize your models to accurately represent all relevant aspects of your plants and processes, no matter how complex they are.
INOSIM provides visualization and reporting channels to analyze your simulation results and to present them to stakeholders attractively, including native Excel support, a powerful Gantt visualization, and the BICON connector to the Business Intelligence solution Tableau. Other export formats can easily be implemented with our scripting engine.
You can equip almost all elements of your model with uncertainties, using a large variety of stochastic distributions. The INOSIM Statistical Analyzer add-on provides powerful statistical analysis capabilities to the user.
INOSIM combines state-of-the-art discrete-event simulation with agent-based elements for flexible and intelligent scheduling of production orders as well as heuristics to compute production schedules that are directly applicable even for the most complex plants. And the INOSIM Optimizer add-on lets you find optimal solutions for your design, engineering, and operational problems.
Via its .NET and COM interfaces, INOSIM models can easily be integrated into your own custom design and engineering toolchains.
INOSIM offers a comprehensive library of unit operations models, covering the areas of heating, cooling, separation, bioprocess engineering, and more.
INOSIM lets you model your production plant and its logistics in the same modeling tool, based on our intuitive graphical production recipes. You will not need to learn two different modeling languages or buy two different tools anymore.
INOSIM provides a flexible material system that supports phases and components to describe the composition of materials as well as properties like temperature, pressure, density, and molar mass. Property data can be imported via our CAPE-OPEN interface.
Interested in a Demo or a Free Trial? Need a Quote?
Let an INOSIM expert show you more about our products in a live demo. Test our complete simulation suite in a free trial. Please contact us to discuss your software needs.


