Custom Bars
Custom bars are a new feature introduced in INOSIM 12. They allow you to display processes in your Gantt chart which are not part of the simulation. Hence, you can display any data as bars in the Gantt chart, e.g., to show the ideal allocation of a unit which can then be compared to that unit’s real allocation.
This tip & trick shows you how to create and apply custom bars by means of the example model BarRows (see download below).
Step 1: Creating bar rows
We start with the creation of new rows in the Gantt chart, called bar rows. Later we will assign our manually created timeblocks, the custom bars, to these rows.
To create them, click New Bar Row in the context menu of bar rows in the INOSIM Database window under Equipment>Bar Rows:
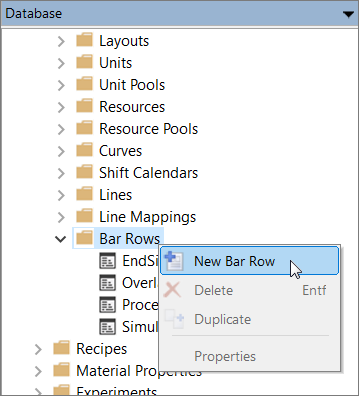
Afterwards, you can edit the bar row names by item Properties in the context menu of each bar row.
Step 2: Generating bars
Custom bars are created directly in Visual Basic. They can be created at any event. The following code shows a user-defined function by which a custom bar is created and assigned to a bar row. The start and end dates of the bar are set: the reference date of the simulation, delayed by the variable tOffset, is set as start date; the end date is delayed by five hours from the start date. Afterwards, the generated bar is added to a custom bar row named Procedure-/Operationview:
Function GenerateBars(tOffset As Double) As CustomBar
  Dim bar As New CustomBar

  bar.StartDate = Simulation.RefDate + tOffset * 3600
  bar.EndDate = bar.StartDate + 5 * 3600

  BarRows("Procedure-/Operationview").CustomBars.Add bar

  Set GenerateBars = bar
End Function
DisplayMode, Label, Color and Other Properties of Custom Bars
In the following code, the function shown above is used to generate three bars by the end of the simulation. Furthermore, two properties of bars are set: DisplayMode defines if a bar is displayed in all views or only in the procedural or operational view. Label defines the text displayed on the bar in the Gantt chart.
Private Sub Simulation_EndSim()
  Dim bar As CustomBar

  Set bar = GenerateBars(10)
  bar.DisplayMode = cbdmAlways
  bar.Label = "Always"

  Set bar = GenerateBars(20)
  bar.DisplayMode = cbdmOperation
  bar.Label = "Op"

  Set bar = GenerateBars(30)
  bar.DisplayMode = cbdmProcedure
  bar.Label = "Proc"
End Sub
Moreover, for each custom bar a color can be specified as an RGB-code. In the following code example, red was chosen:
Dim bar As New CustomBar
bar.Color = RGB(255,0,0)
Furthermore, custom attributes can be assigned. (In the following example, the value of the variable barCount is assigned to the CustomAtttribute Number. Here, the variable barCount corresponds to the current number of generated bars.)
'barCount is defined beforehand, and incremented whenever a new bar is created
bar.CustomAttributes("Number") = barCount
Finally, you can retrieve for each bar to which bar row it belongs. In the following example, the bar row of custom bar myBar is assigned to a BarRow variable myRow:
Dim myRow As BarRow
Set myRow = myBar.BarRow
Please note: You are free to use any kind of data to parameterize the bars. For example, instead of specifying the data directly in VBA, you may also store the data in INOSIM’s Parameters workbook. This allows you to display any easily changeable input to be displayed as bars in the Gantt Chart.
Step 3: Viewing custom bars
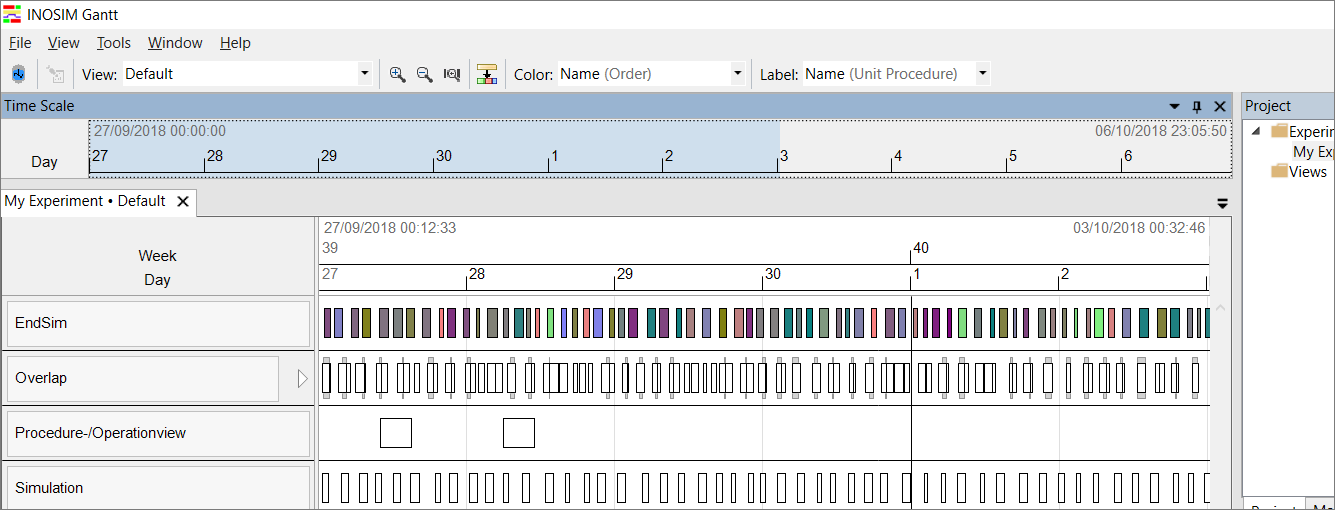
Run your simulation in INOSIM. The custom bars you created can be seen in the Gantt Chart. The following figure shows the Gantt Chart from the example project.
- Example Project
- PDF printout of this Tip & Trick
More Questions?
Want to know more about this topic or have another question? Please contact us!
More Tips & Tricks
Measuring the Execution Duration of VBA Controls
This Tip & Trick is about using a VBA Timer execution timer for VBA controls and measuring the execution duration of VBA controls. To check…
Applying Table Objects
Table objects in INOSIM are indexed tables. By the row or column headline, you can directly access a cell’s content without having to search for…
Custom Probability Distributions
Learn how to use the implemented probability distributions in INOSIM to add stochastic failures or process parameters to your model, and how to set up…