In this tip, you learn how to create PDFs which display a selected time range of a complex Gantt chart. You also learn how to add your logo to the header of a PDF generated by INOSIM.
The INOSIM Gantt chart gives a comprehensive overview of your simulated process. You wish to provide it to your colleagues or customers? One option might be that these persons use the free INOSIM Viewer License to view the Gantt chart.
Sometimes, though, there is a demand for a printed Gantt chart or a PDF file, e.g., for documentation purposes within the engineering process. You can create such files easily with INOSIM Gantt. By the following instructions, we show you how to display even complex Gantt charts in oversized formats as PDF files:
PDF printer configuration
You have created a complex process and wish to provide the simulation results as a PDF file or a large-size printout. But, as you see by the print preview of your INOSIM Gantt, your chart is split into several pages due to its size.
To display your complete Gantt chart on a single PDF page, you need a sufficient paper size. In menu File/Page Setup, you see the paper sizes which are currently provided by your system:
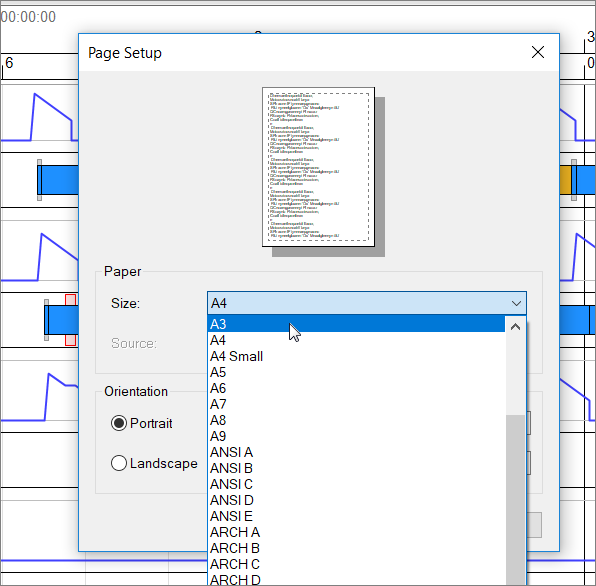
If the largest paper size provided by your system (e.g. A3) is not sufficient to display your chart on a single page, you might extend your printer configuration with a freeware tool like PDF24. That software provides paper sizes up to DIN B0, which means 100 x 141 cm. Furthermore, PDF24 enables custom page sizes up to 35 m edge length (as shown in the last section of this page).
Creating a complex PDF with INOSIM Gantt
- If necessary, install an appropriate PDF printer like PDF24 on your system.
- Start INOSIM and INOSIM Gantt.
- Open an experiment.
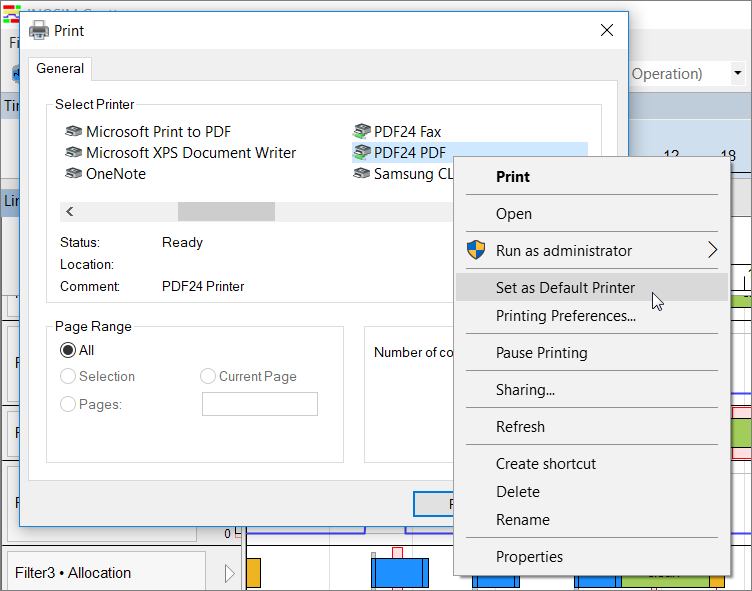
- In INOSIM Gantt, via File/Print set your requested PDF printer as default printer (select the printer, then right-click):
- Close the Print dialog. Then close INOSIM Gantt and start it anew.
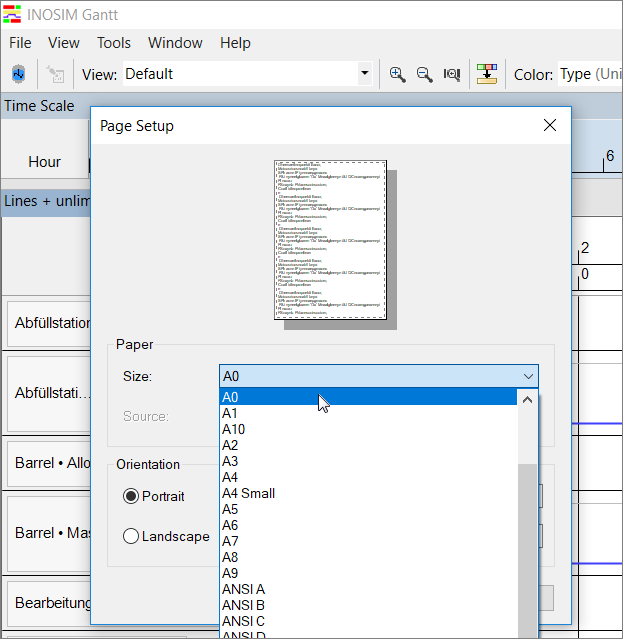
- Afterwards, via File/Page Setup select the requested paper size as well as orientation and margins:
- By default, the Gantt chart of the experiment which you intend to print displays the complete simulated time range. If you wish to display only a partial time range, do the following:
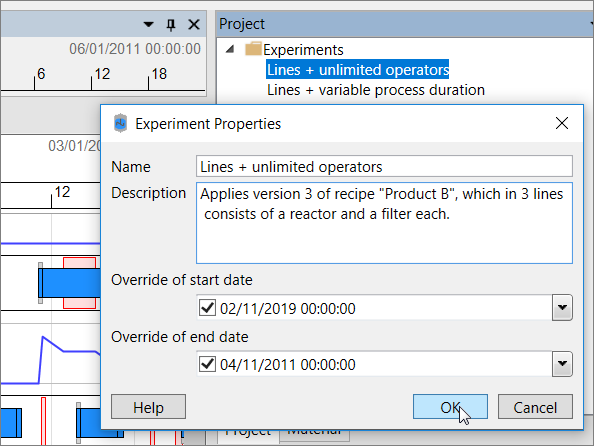
- In INOSIM Gantt, open the properties dialog of the experiment and define the time range to be displayed using the options Override of start date and Override of end date:
-
- Close the chart of the experiment and open it anew.
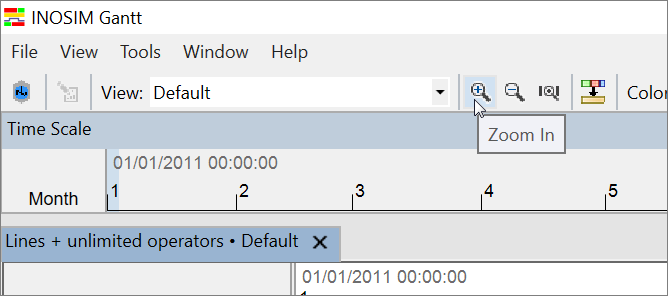
- By File/Print Preview, check if the time range covered by the chart is correctly displayed on a single page. If the picture given by the print preview is too narrow or wide, adjust the Gantt chart’s zoom stepwise until the picture fits perfectly with the print preview of a single page.
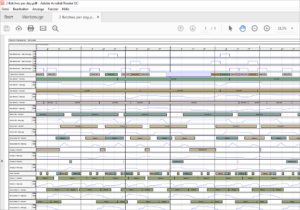
- By File/Print, you can now save the output. This results in a PDF file which can be opened with any PDF viewer, as in the following complex example:
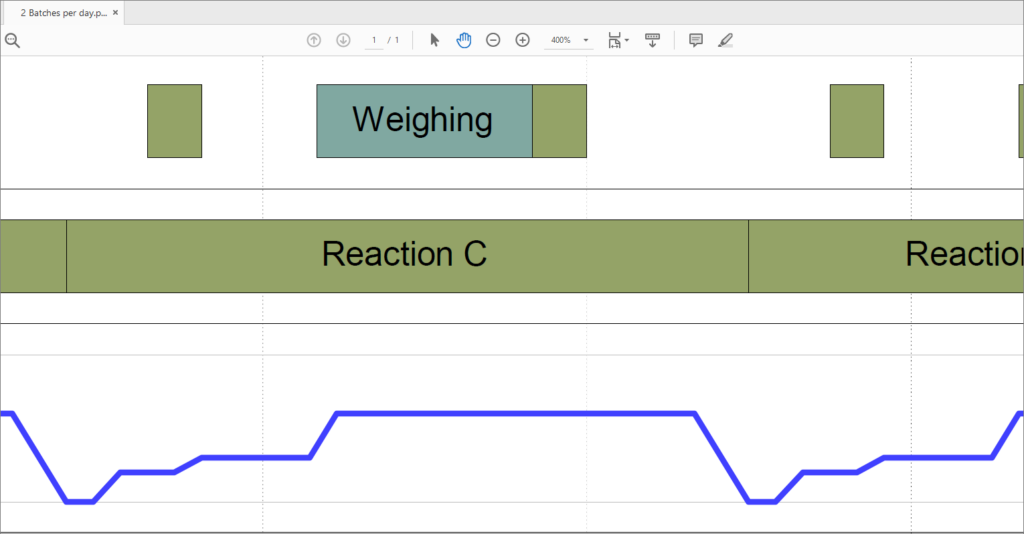
- Zoom in to this PDF file without quality losses to be able to view partial aspects in detail:
Defining a custom header for a print document
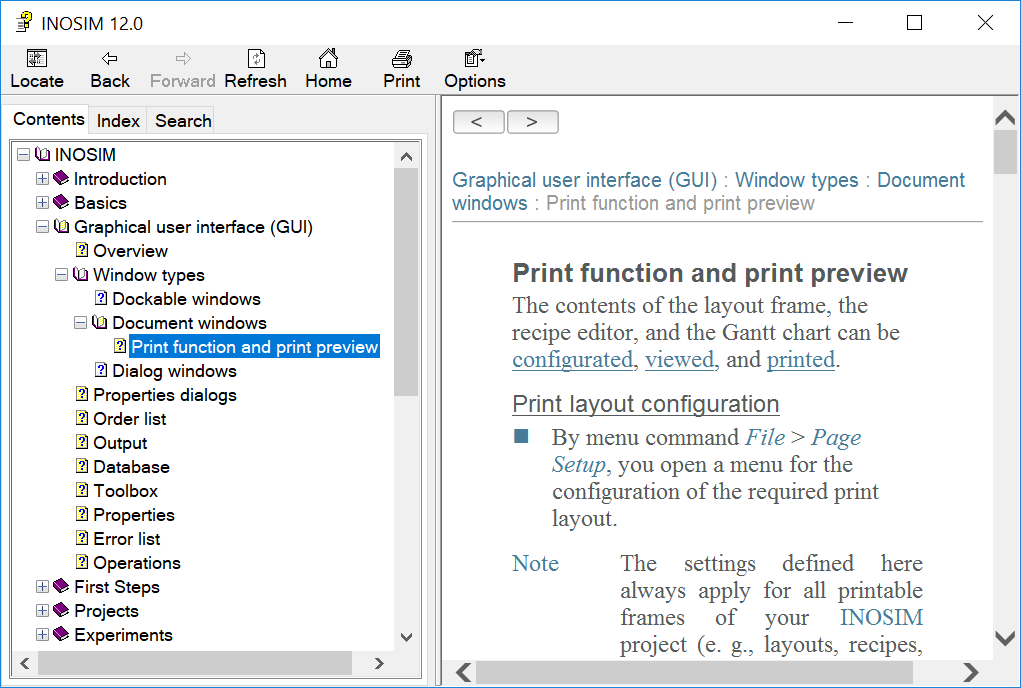
Each document printed with INOSIM has a header. For a Gantt chart, that header contains the names of the experiment and the displayed view together with an INOSIM logo. You can disable that logo or replace it with your own company´s logo. In the INOSIM onlinehelp, that procedure is extensively described under Graphical User Interface (GUI)/Window types/ Document windows/Print function and print preview.
Creating custom paper sizes with PDF24
- Install PDF24 on your system.
- Make sure that in INOSIM Gantt, PDF24, as described above, is set as default printer.
- If necessary, close and restart INOSIM Gantt.
- If necessary, open your experiment.
- In INOSIM Gantt, open dialog File/Print.
- On tab General, select printer PDF24 PDF.
- On tab General, select Preferences.
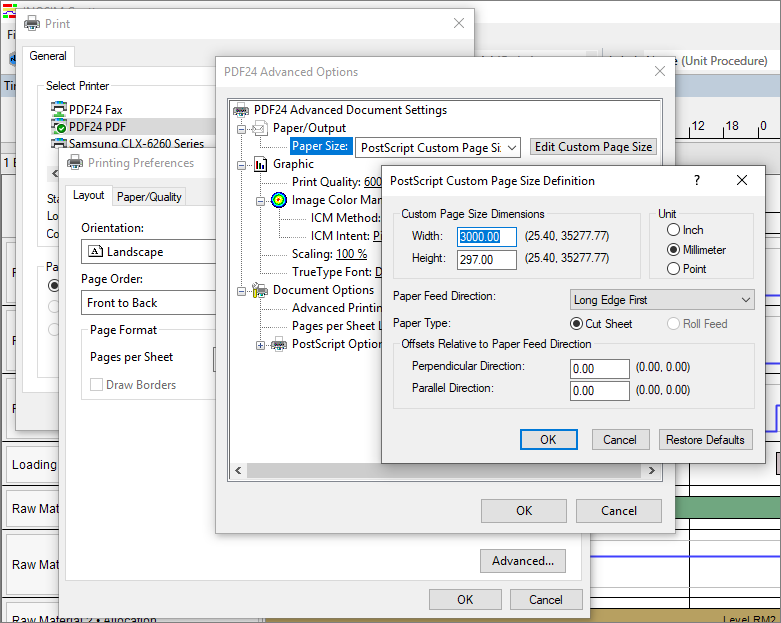
- On tab Layout, select Advanced.
- Under Paper/Output, select paper size PostScript Custom Page Size. Here you can define width and height as custom page size dimensions.
- PDF printout of this Tip & Trick
More Questions?
Want to know more about this topic or have another question? Please contact us!
More Tips & Tricks
Working With External Excel Workbooks
Working With External Excel Workbooks Beside access to the Excel workbook built in to INOSIM (see tip Benefit From Your Excel Knowledge While Working With…
Transfer Analysis with Power BI
In this tip and trick, the Transfer Analysis dashboard is introduced. It is an extension of the Power BI standard dashboard that allows you to…
Printing Complex Gantt Charts As PDFs
In this tip, you learn how to create PDFs which display a selected time range of a complex Gantt chart. You also learn how to…